Excel bad. Why?
People love to give excel crap. It's not the tool - it's the speed it encourages you to create at.
Why Excel is considered a villain in the BI space
Excel isn't the villain. BI tools aren't the villain either. But somewhere between the two, most organisations hit a wall. It's not a technology problem. It's a speed problem.
Not the absence of speed. The excess of it.
Everyone loves excel, and rightly so.
There's a reason Excel is the most widely used analytics tool on the planet: it's absurdly easy to get started. You open a workbook, type a formula, and you're encoding business logic. No deployment pipeline, no data model, no permissions. Just you, a medley of cells, and an idea.
That frictionlessness is genuinely awesome. It's usually what gets people started with data. Parsing numbers, building reports, making decisions backed by something more than gut feel. Anyone can inject business logic into a spreadsheet, and it just works. That's not a flaw. That's the feature.
But it's also the trap.
The invisible cascade
Here's what most people miss: business logic isn't just parallel. It's deeply sequential. Every formula you write doesn't just do its own job. It becomes a dependency for every formula that follows after it.
Take something as mundane as deducting a shipping cost from a transaction total. That's one decision, living in one cell. But downstream, that adjusted number feeds into margin calculations, profitability summaries, forecasting models, and executive dashboards. Hundreds of data points now inherit that single piece of logic. Sometimes that piece of logic makes a 'hop' into other workbooks, and other workbooks 'hop' into others. Funny little rabbits, aren't they?
And this is fine. That is, until someone changes the shipping cost logic, or realises it was wrong from the start. Now you've got a cascade of business decisions built on top of a foundation that nobody remembers building. A single number in a single cell can obscure an entire chain of reasoning, and in a mature workbook, that chain is invisible. I thought AI would make this better - but even the best models get confused and stuck. There's just too much going on.
When restarting becomes easier than editing.
This is where the real problem lives. In Excel - and like in any other areas of technology - adding new logic is almost always easier than editing existing logic. And because of that, people don't fix their foundations. They just build, and build, and build.
Nobody edits a formula. Not really. People are quite rationally scared of breaking something they don't fully understand. So instead, they patch. And build. It’s the path of least resistance. Interestingly, I've found that constantly defaulting to the path of least resistance (whether in a spreadsheet or in our daily routines) is exactly what triggers the worst kinds of personal burnout and procrastination.They add a new column, a new tab, a workaround formula that compensates for whatever's wrong three layers down. The workbook grows, not through careful design, but through accretion.
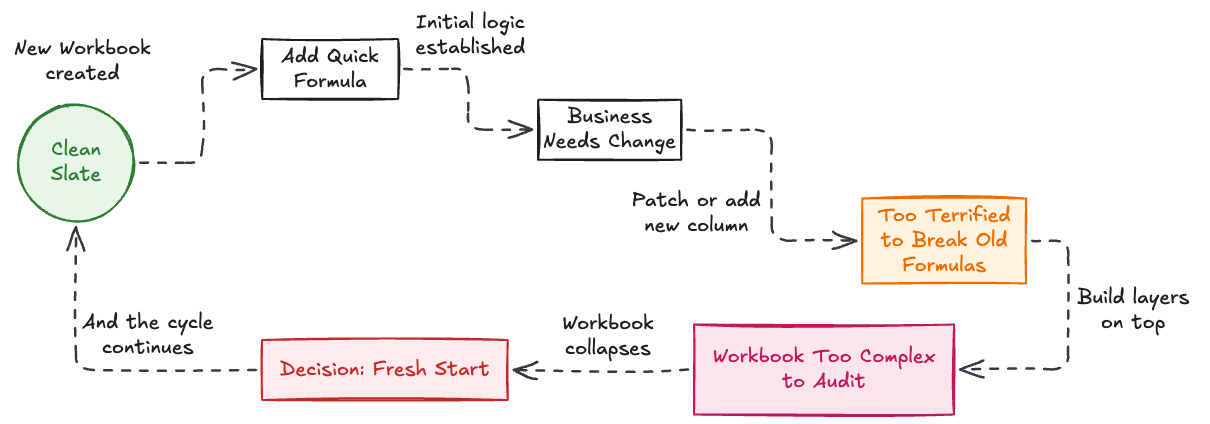
Eventually, you hit a boiling point. The workbook has become so layered with patchwork logic that editing any single piece risks collapsing the whole structure. And so, predictably, someone starts a brand new workbook. A fresh start. A clean slate. It feels great. And the cycle continues.
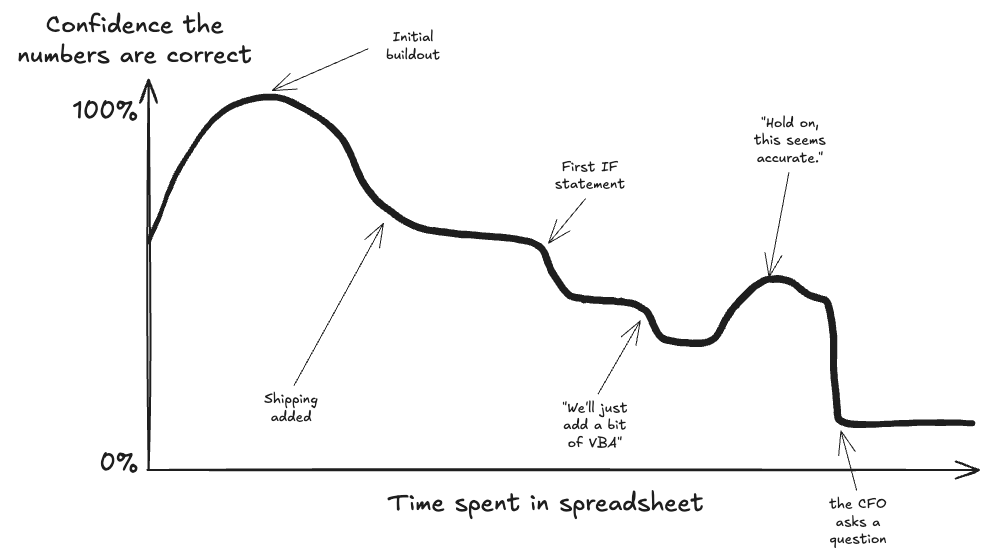
A Margin Calculation, in Five Acts
If this all sounds abstract, here's how it actually plays out. Imagine you're running an e-commerce business, and you need to know your gross margin per order.
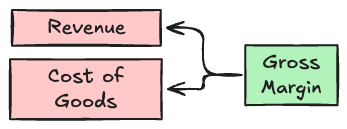
Act 1. The simple version. Someone on the finance team builds a clean workbook. Revenue minus cost of goods, divided by revenue. One formula, one column. It's elegant. It works.
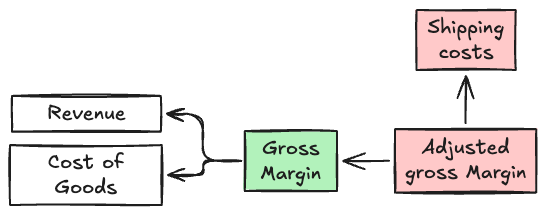
Act 2. Shipping enters the chat. A few months later, someone realises shipping costs aren't being accounted for. Rather than rethinking the margin formula, they add a new column that subtracts shipping from the original margin figure. Quick fix. Nobody touches the original formula.
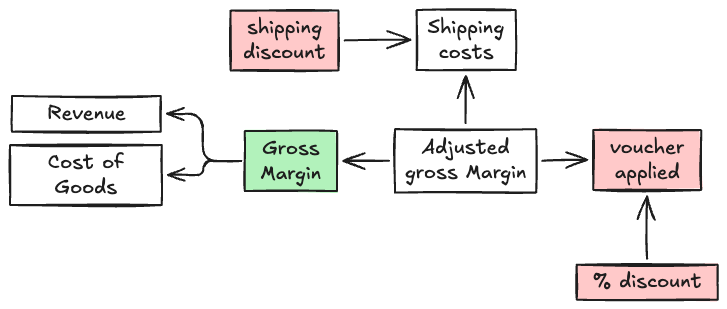
Act 3. Discounts and promotions. Marketing starts running promotions. Some orders have percentage discounts, some have fixed-amount vouchers, some have free shipping. Each gets its own column, its own logic, bolted on beside the others. The "true margin" is now the result of five or six columns chained together, each encoding a different business decision.
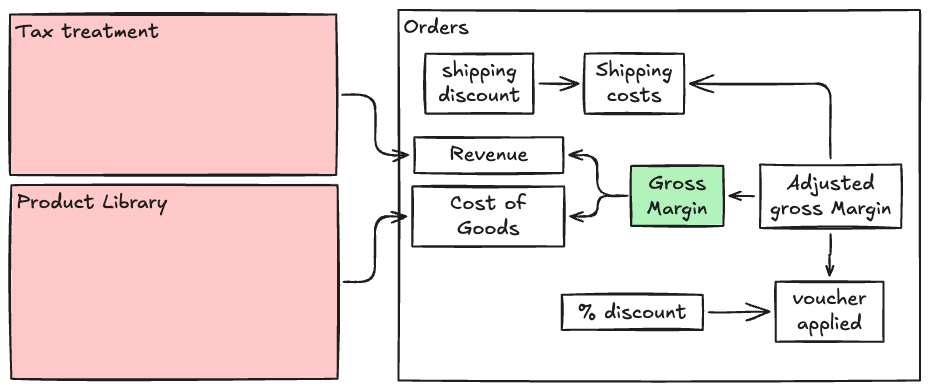
Act 4. The regional tax problem. The business expands internationally. Tax treatment varies by country. Someone adds an IF statement — then a nested IF, then a VLOOKUP to a reference table on another tab. The formula in the margin column is now 200 characters long and references three different sheets.
Act 5. Nobody knows what's real. Eighteen months in, the CFO asks a simple question: "What's our actual margin on UK orders after returns?" Nobody can answer it with confidence. The workbook has the number, somewhere, but nobody's sure which column is the canonical one. There are three tabs that each claim to show "adjusted margin," built by three different people at three different times. Somebody starts a fresh workbook.
The tragedy isn't that anyone made a bad decision. Every single change was reasonable in isolation. The tragedy is that each one was added rather than integrated — layered on top without ever going back to rethink the foundation. And by the time the cracks showed, the cost of unpicking it all was higher than the cost of starting over.
That's logic debt in action.
The case for friction
This is counterintuitive, but hear me out: a little friction in the process is a good thing.
When building a more structured BI system, whether that's a data warehouse, a proper modelling layer, or any kind of governed analytics environment, there's inherent friction. You have to define your transformations explicitly. You have to think about naming, about dependencies, about what happens when something upstream changes. That friction feels slow. It feels like overhead. But it makes you think.
By the way, what happened to having a think?
But what it actually does is force you to confront your business logic head-on. It forces you to understand the decisions that were made, why they were made, and whether they still hold. It forces you to step back from the problem instead of just bolting another formula onto the pile. Why are we deducting shipping costs from totals? What good does it do us to create a column that considers returned orders?
In a workbook, you'd do it "just in case", or "because it may be useful".
A word of caution, though: BI tools don't get a free pass here. Modern platforms like Tableau and Power BI have become dramatically easier to use. This is great for adoption and terrible for the assumption that "moving to BI" automatically means better governance. You can absolutely build spaghetti logic in a dashboard. You can create calculated fields that nobody understands, chain data sources together in ways that obscure their lineage, and end up with a BI environment that's just as opaque as the workbook it replaced. Only now it's got a login screen (and costs you enterprise licences).
The friction isn't inherent to the tool. It's inherent to the discipline a team chooses to impose on themselves. A BI platform gives you the scaffolding to build governed, traceable, well-documented logic. But it doesn't force you to use it. That's on the data team, not the software.
Excel Isn't the Problem
The real issue isn't the tool. It's the pattern that frictionless tools encourage: rapid creation of business logic without any corresponding mechanism for reviewing, editing, or governing that logic. Excel makes it trivially easy to encode a decision and almost impossibly hard to trace, audit, or revise it later.
That's not Excel's fault. It was never designed to be a governed analytics platform. But when organisations treat it like one, they end up with sprawling webs of formulas and calculations that are, practically speaking, impossible to unpick.
Slow is fast
Speed matters. Nobody's arguing otherwise. But speed without structure creates a specific kind of debt. Logic debt. Debt that compounds quietly until it becomes the single biggest bottleneck in your analytics.
Sometimes the most productive thing you can do is slow down. Resist the urge to add another formula. Go back and understand what's already there. Fix what's broken instead of building around it.
Now, here's the part where I have to be honest: this advice is easy to write and brutally hard to execute. Because in most organisations, someone in leadership needs an answer today. Not after a three-week BI sprint. Not after a proper data modelling exercise. Today. And when that pressure hits, analysts do what's rational. They open Excel, because the business won't wait.
This is the real tension, and pretending it doesn't exist would make this entire argument feel academic. The "slow down" philosophy doesn't work if it's only embraced by the data team. It has to be understood (and protected) by leadership too. That means building a culture where investing a week to fix a broken foundation is seen as progress, not delay. Where the person who stops to untangle a workbook is valued as much as the person who ships a report by lunchtime.
Good, steady progress will always outrun fast, fragile progress. But only if the organisation has the patience to let it.